
In this post, we are going to see how we can combine different indicators/concepts to create confluence zones and find high-probability trades.
Table of Contents
ToggleIntroduction
A trade that has a greater chance of success than a regular trade is called a high-probability trade. Obviously, it’s our assumption that some trades have higher chances of success as compared to others because they have more supporting factors. Nevertheless, a high probability trade can also result in a loss.
How to find high-probability trades?
There are a few things that you can observe to find a confluence of various important factors such as a support/resistance level, demand/ supply zone , Fibonacci level, moving averages, volume , RSI , etc.
Depending on your knowledge and trading style, the confluence zone can be derived using a combination of various different concepts or indicators. In this post, I am going to share the factors that I look at for finding good trades.
How to find confluence zones?
In order to find the confluence zones, you need to understand the concepts and the indicators, then combine them together to create the whole picture. It’s like building a jigsaw puzzle – first, you need to identify the individual pieces, and then you need to put them together.
Let’s dive into all of these concepts one by one.
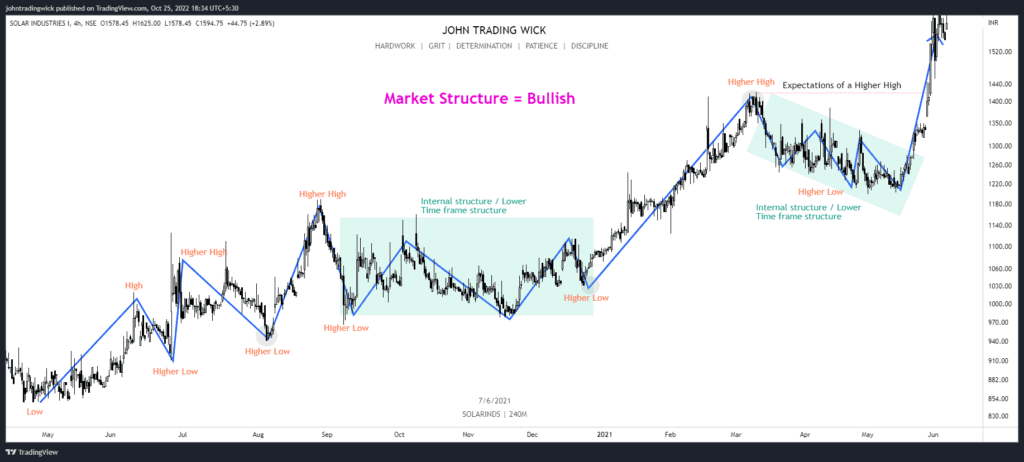
1. Market structure
Market structure is simply a basic form of understanding how the markets move. The price action is how the market moves based just on price, without the consideration of trends and how they may continue. But the market structure is focused mainly on the trend.
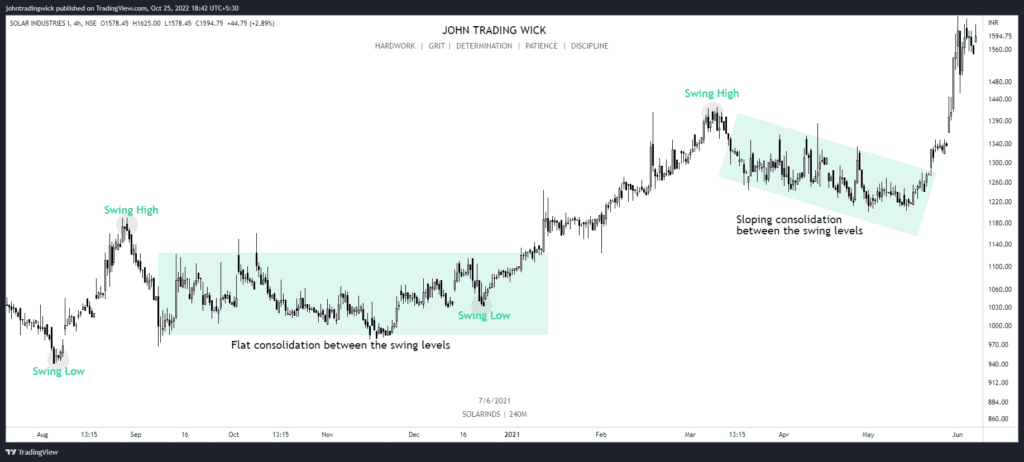
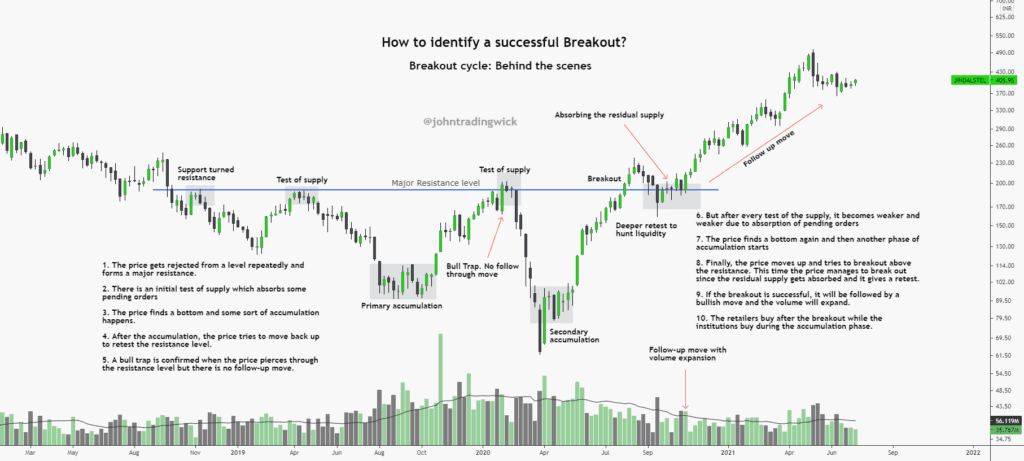
2. Consolidation before Breakout
If a stock consolidates before giving a breakout, there are higher chances that it will be a true breakout. This is because all the residual supply gets absorbed at the resistance zone and most of the pending demand orders get filled.
Ideally, once a stock goes into consolidation, one of the two processes occurs:
- Accumulation
- Distribution
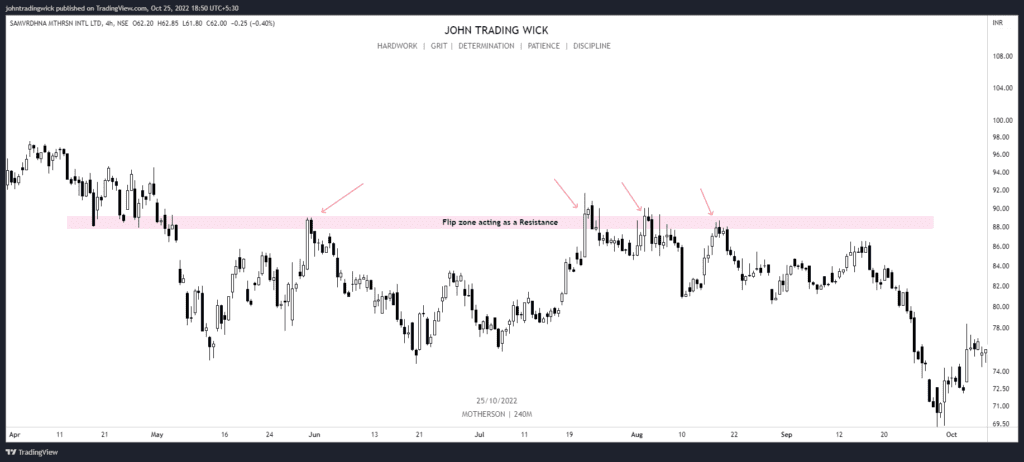
3. Support-Resistance levels
S/R levels are critical parts of trend analysis because they are used to highlight important zones.
The fact that these levels flip roles between support and resistance can be used to determine the range of a market, trade reversals, bounces, or breakouts. These levels exist due to the influx of buyers and sellers at key junctures.
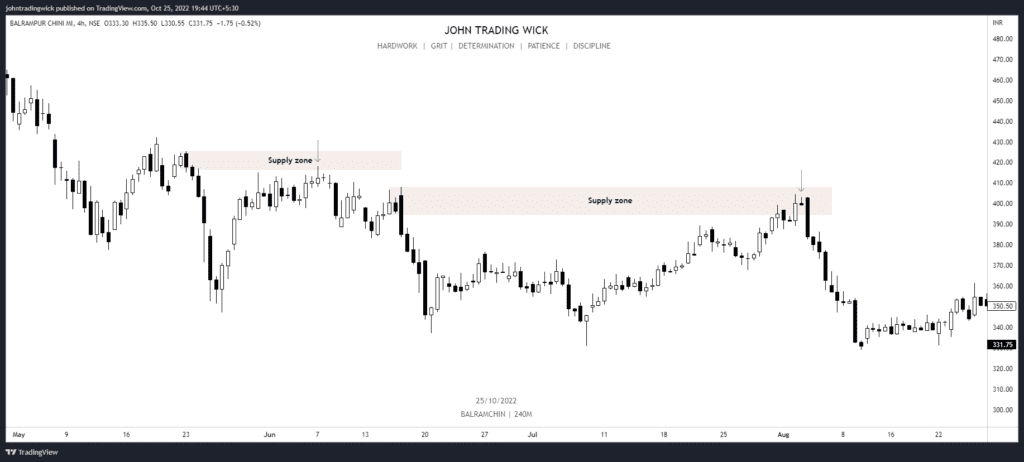
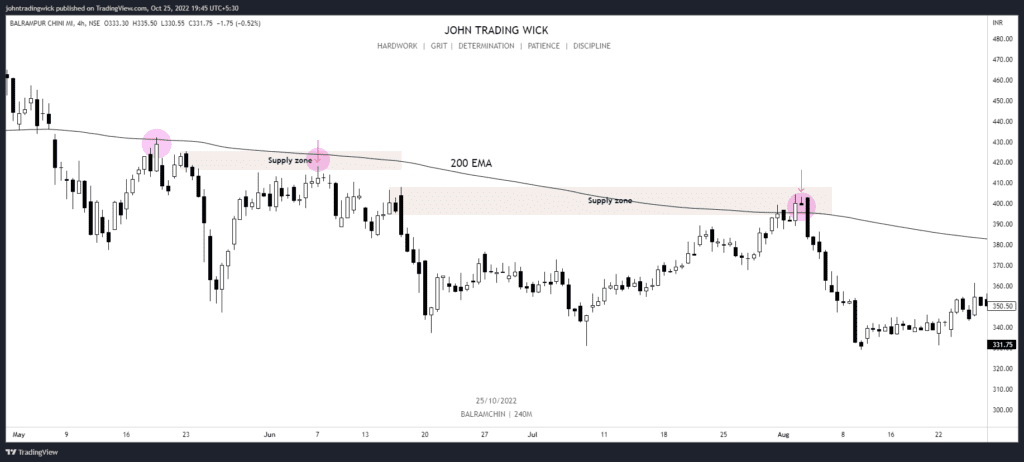
4. Supply-Demand zones
S/D demand zones are one of the most important things that I look at while charting. The stronger the S/D zone, the higher the chances of a reaction. Always look for these zones in the direction of the major trend.
5. Location of 200MA or 200EMA
Always observe the position of 200MA/ EMA with respect to price. Once the price interacts with the moving average, study the reaction. If you are looking for a long trade, then look for a positive reaction as the price reacts with the moving average.
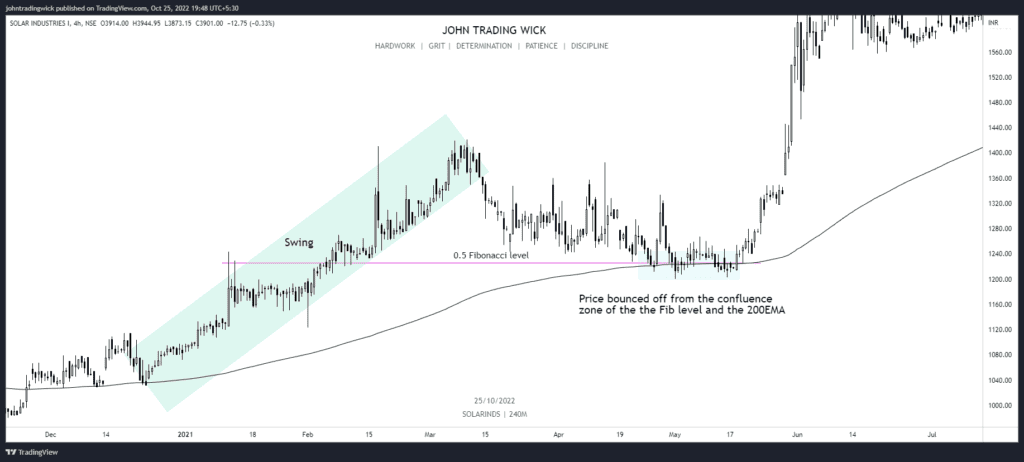
6. Overlap with a Fibonacci level
A lot of times, the price will come back to a Fibonacci level. You need to observe the price behaviour near these levels.
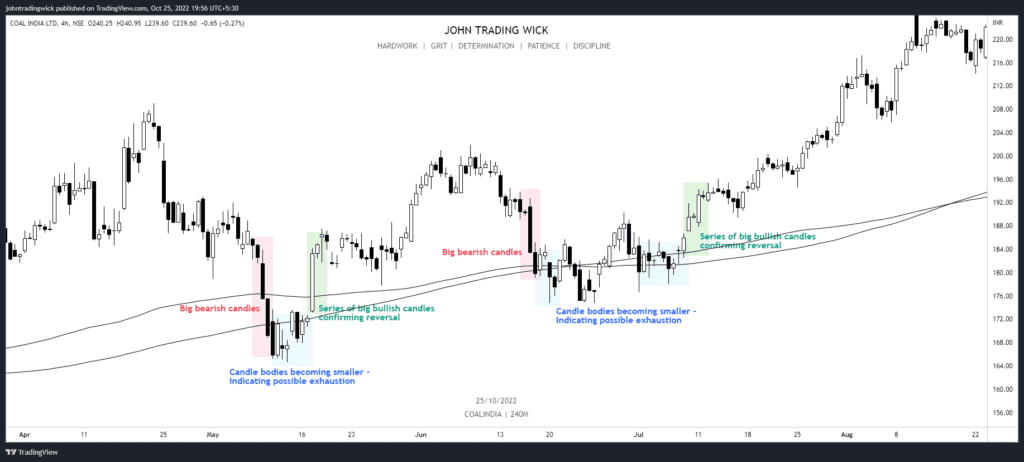
7. Candlestick pattern and the size of the candles
The candle spread plays an important role in determining the strength and mood of the underlying trend. In layman’s terms, big-bodied candles indicate strength and small-bodied candles act as noise.
In any case, the candlestick pattern and candle spread should only be viewed at an important level. The context plays a crucial role.
8. Chart patterns
This is pretty self-explanatory. If you trade patterns, you can combine them with other factors to strengthen your analysis
9. Volume expansion
Ideally, at the time of the breakout, the volumes should rise. The volume can be deceiving and we need to see order flow for a clear picture. Obviously, the majority of us are not looking at the order flow and hence the volumes can be deceiving.
But, for a normal trader, the simple volume indicator is more than enough.
So, these are mainly all of the factors that I look at while analyzing the charts. Please note that the usage of the concepts will vary with charts. Sometimes only 3-4 factors may be at play and the other times, 6-7.
Example.......

In the example above, you can notice the following things:
1. The market structure was bullish before the breakout, which was evident from the formation of higher highs and higher lows. Don’t confuse the internal structure (Low time frame structure) with the external structure (High time frame structure).
2. The price was consolidating in the rectangle / parallel channel for a good amount of time.
3. When the price reached the previous demand zone , the selling pressure started to decrease and the buyers started to step in.
4. When the price interacted with 200MA/ EMA , there was a strong reaction to the upside. This means that the buyers want to take the price higher.
6. The buying interest can be seen by an increase in the volume in the last few sessions before the breakout. The volume can be deceiving and we need to see orderflow for a clear picture. But in general, you do not need to complicate this, just use volumes in conjunction with other factors.
7. We always look for some reversal or indecision candlesticks in the confluence zone. In the chart above, at the point of interaction with the moving average and the demand zone , we can see the formation of exhaustion candles.
Again, we need to look at these patterns only at specific important levels (like support or resistance levels) and disregard the formations in between the levels.
8. When the price broke above the previous major resistance with a massive bullish candle, there was a heavy volume expansion.


Pingback: What are ratios to analyze any banking stocks - Money & My Idea